Databasing Danish Schools
From the Series: Digital Ontology
From the Series: Digital Ontology

The Danish Ministry of Education is currently making changes to its Management Information System, known as LIS. LIS is a common and mundane spreadsheet database technology, organized around hierarchies of categories and subcategories, each containing rows with numerical data such as pupils’ test results, their absences from class, and measures of their well-being. It is mandatory to report on some of these indicators in quality reports, a tool for governing primary schools according to their attainment of quantitative objectives. The Ministry of Education allows public access to LIS, although—for many indicators—only in an aggregate form due to privacy concerns. A central feature of the new LIS is granular access control, by which local governments and schools have access to specific data pertaining to their institutions. Instead of holding onto data, the Ministry intends to “give back data” to the practitioners who need it to develop a “systematic evaluation culture,” as one civil servant put it.
How can we think ethnographically about this rather ordinary database technology? Does it materialize an ontology of the digital? I will suggest that LIS advances particularconfigurations of difference and scale. My emphasis on the particular is meant to challenge any idea of “the” digital, which would assume a commonality across different practices all of which enact something that we could delimit as digital. Thus, I will refrain from answering the question of whether there is an ontology of the digital in general. Also, while much has been said about how database technologies such as LIS materialize a neoliberal government logic by rendering educational institutions calculable and manageable (e.g., Ball 2015), I focus my attention on figurations of difference and scale conjured by the ambition to give back data.
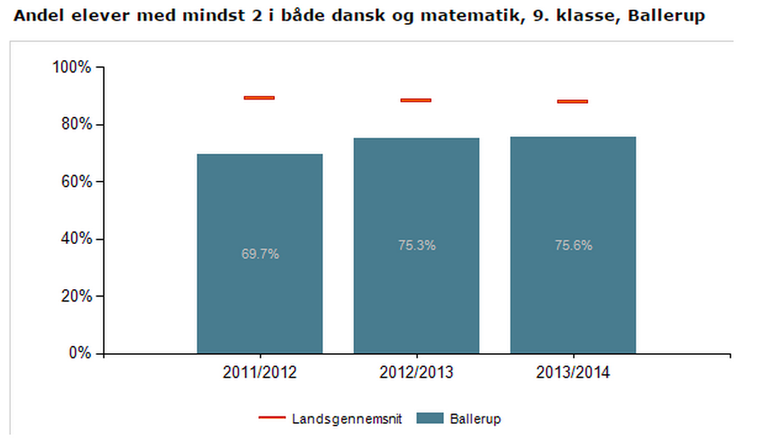
“Giving back” assumes that data returns to its place of origin in its original form. LIS, however, joins up data from many different sources to produce standardized data (e.g., assessment grades). The granular data, moreover, returns in a form that entails comparisons and valuations; these are visualized through tables, graphs, or column charts. The image below shows the proportion of pupils in the municipality of Ballerup who graduated with the minimum acceptable score in both math and Danish.

The vertical axis shows percentages and indicates the distance to the national objective of 100 percent. The vertical bars show Ballerup’s performance over time; by adding earlier versions of the same data, a pattern is produced across temporal intervals. The graph enacts a sense of movement, in the right or wrong direction. The red line above each bar indicates the national average, which positions Ballerup in relation to a whole. LIS produces this whole by collapsing all differences into a single point—the total average. Ballerup’s performance is thus rendered visible as above or below, further from or closer to, the national average. LIS thus gives back data in a form that is linked to past performance, national averages, and national objectives.
LIS allows for multiple ways of relating parts to wholes. The pupil can be a part in relation to the class, the school, the local government, or Denmark. These wholes can in turn be viewed as parts: a class can be part of a school, a school of a municipality, and a municipality of the nation. An aggregate can become a part of another aggregate by changing the starting point of comparison. The database can thus both collapse and add difference. This dynamic both reifies and obviates relations between parts and whole. Indeed, LIS might be said to enact a digital version of Marilyn Strathern’s (1992) merography, in which similarity and difference are produced through connections between discrete entities.
The gift of data (see Mauss 1990) also fabricates relations, not primarily between the Ministry of Education and individual institutions, but rather within each institution. Civil servants at the Ministry envision that granular access to data will help practitioners evaluate and anticipate their pupils’ and institutions’ performance. Data is imagined to shape social relationships between teachers and pupils, managers and teachers, and local government and schools, by identifying impediments to reaching national goals. Data in LIS, then, is not simply representational but is deemed to be instrumental in changing local pedagogical practices, changes that will eventually feed updated performance indicators back into the database.
An emerging concern in the Ministry is whether practitioners can, in fact, relate the data to pedagogical practices. One civil servant explained how experiments with database technologies in secondary schools revealed that managers enjoy the opportunity to “play” with combinations of indicators and different levels of comparison. This invitation to relate to numbers in a playful and creative way is central to the new LIS: its potential to trace novel patterns across pupil populations and indicators. Such play compels users to imagine patterns as correlations and probabilities between x and y, to continuously restage relatedness and difference.
What are the generative properties of LIS? How does it configure difference? As a database, it invites searching and combining of different indicators (for instance, socioeconomic status and grades). It also enacts parts and wholes through collapsing and adding difference across the governance hierarchy. Difference is collapsed through the production of a numerical average, which can be expanded again into rows of subcategories and numbers. As these capacities emerge from the database organization of numerical data in spreadsheet form, we might think of them as a digital ontology. The question of whether this speaks for the digital mimics LIS’s merographic compulsion to connect elements considered to be different from one another in order to discover their similarities and differences.
Ball, Stephen J. 2015. “Education, Governance, and the Tyranny of Numbers.” Journal of Education Policy 30, no. 3: 299–301.
Mauss, Marcel. 1990. The Gift: The Form and Reason for Exchange in Archaic Societies.Translated by W. D. Halls. London: Routledge. Originally published in 1925.
Strathern, Marilyn. 1992. After Nature: English Kinship in the Late Twentieth Century. Cambridge: Cambridge University Press.