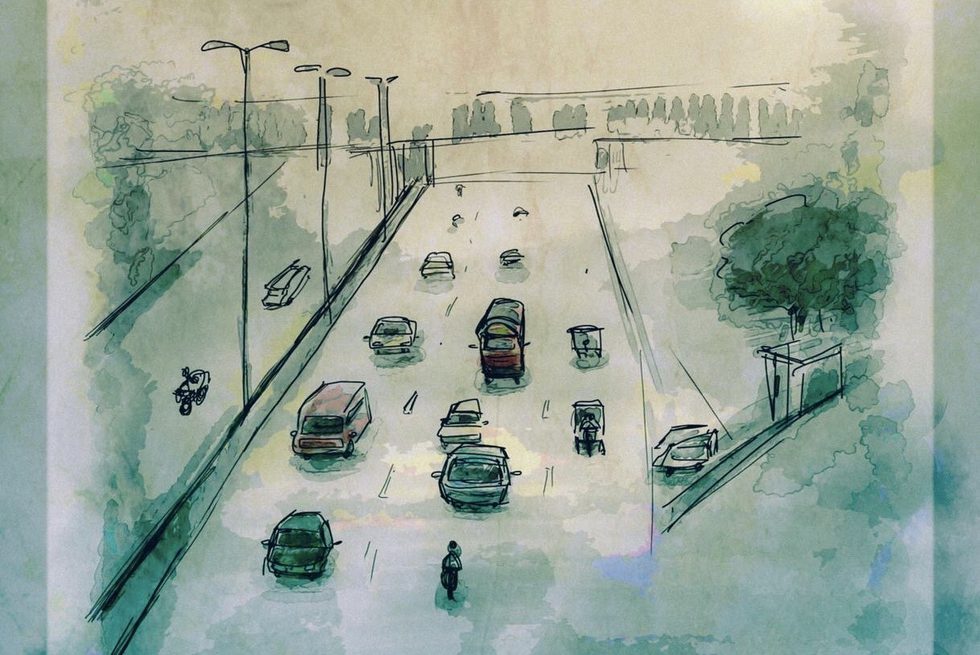
My city, Lahore, is disappearing.
There is nothing figurative about that sentence. I genuinely cannot see my hometown outside my window. The skyline is a haze . . . You should be able to see cities. You should not be able to see the air. We seem to have confused the two in Lahore.
—Rimmel Mohydin, South Asia Campaigner, Amnesty International
For the last four years, between the months of October and January, an annual coat of smog has settled over Lahore. Air pollution has become a major public health and environmental issue for Pakistan’s second most populous city, and for the country as a whole. In November 2019, three high school and college students filed a petition before the Lahore High Court against several provincial governmental bodies for the “violation of their fundamental right to a clean and healthy environment” (Writ of Petition No.66265/2019, Leila Alam and others v Punjab Environmental Protection Council and others, part A “Facts” at para 8). Three weeks after the petition was filed, Amnesty International issued an "Urgent Action" expressing alarm about “the risks that the hazardous air poses for the health and lives of the people in . . . Lahore” and calling for swift government action.
Smog in Lahore is a calamity of visibility: in Lahore, you may simultaneously “see air” while being kept in the dark about air quality. A central concern for Amnesty’s Urgent Action, the High Court petition, as well as journalists’ reporting in recent years has been the paucity of information about Lahore’s air, as evident in coverage in the Guardian, the New York Times, and Dawn. Amnesty calls for “access to correct information about the severity of the smog” and the petition demands that, among other remedies, the Punjab’s Environmental Protection Department (EPD) provides “real-time air quality information from all of its air monitoring stations to the public via its website” (Petition, part C “prayer” at para 3). State officials, on the other hand, contest the measurements of air quality that have circulated in Pakistan’s media and online. As Zartaj Gul Wazir, the Minister of State for Climate Change, Government of Pakistan, tweeted in October 2019, “[d]eliberately misinformation [sic] is being spread about Lahore Air Quality. It is nowhere as bad as being asserted by vested elements.”
The controversy about air quality in Lahore concerns not only its causes or solutions but more basically, its measurement: how, and by whom, is air rendered knowable to the public? Or, as I will discuss in connection to several corporate and government interventions, how is air pollution made visible? Debates around Lahore’s air quality echo the observation that late industrial environments are “materialized as uncertain events” (Murphy 2006, 7; see also Murphy 2008; Fortun 2012; Whitington 2018). Moreover, as Timothy Choy and Jerry Zee (2015) note, the atmosphere is frequently depicted as dangerous and a potential site of violence. To cope with this danger and violence, we demand new ways of knowing our environment: new technologies with which to observe and measure alongside new languages for understanding this information. In the case of Lahore’s air, this has generated novel symbols, signs, and visual representations that may communicate such information. These, in turn, raise crucial questions about the kind of persons that medias, tools, or interventions anticipate. All Lahoris are "breathers" (Choy 2012) and some are also potential consumers of information about air pollution and applications that relay it.
This past winter I experienced Lahore’s smog season for the first time while studying at the Lahore University of Management Sciences (LUMS) and undertaking preliminary fieldwork. I felt betrayed by my senses. One November night the sky was cloaked with such a thick gray haze that from LUMS we could only hear—and not see—the overhead airplanes landing at the nearby airport. While the air was chock-full of particulate matter during a few days, most days I could only venture an amateur guess about the air quality. Lahoris speculate about the air based on the intensity of the sun or the forecast of rain, paralleling Timothy Choy’s (2012, 144) observation that people have “techniques for reading the air—dirtiness, wetness, heat, breeze, height.” Yet, breathers cannot really determine the conditions of the air, and thus its impacts on one’s health, by their senses alone. This situation is compounded by the fact that smog is frequently confused with other atmospheric conditions like fog.
This atmospheric uncertainty has dominated discourses about smog in Lahore. In July 2018, the founder of the Pakistan Air Quality Initiative, Abid Omar, began his TEDxLahore talk with an alarming rhetorical question:
[D]id you know that in Punjab . . . your life expectancy is reduced by five years because of how bad the air pollution is over here? A lot of you have been wondering that it doesn’t look so bad when I look outside, actually the air seems to be quite alright. But the problem is actually quite breath-taking.
This uncertainty, however, seems resolvable through technological interventions. The invisible can be made visible through data. Omar continues his TEDxLahore talk by pointing out that prior to 2011 (in Lahore) and 2008 (in Karachi), even basic data about air quality was unavailable. In 2017, the Punjab’s Environment Protection Department came under fire for having purchased six air-quality monitors the year before but not installing them until there was a public outcry. Ahmad Rafay Alam, the Lahore-based environmental lawyer who filed the 2019 petition, termed this “a crisis of data.” Recent interventions by the state, civil society, and corporations have generated and circulated atmospheric data. In this way, the emergence of Lahore’s smog season parallels the development of new ways of knowing through new “information infrastructures” (Bowker et al. 2010; Whitington 2018) or “environmental information systems” (Fortun 2012). In particular, these new systems involve techniques of observation, measurement, comparison, translation, and communication.
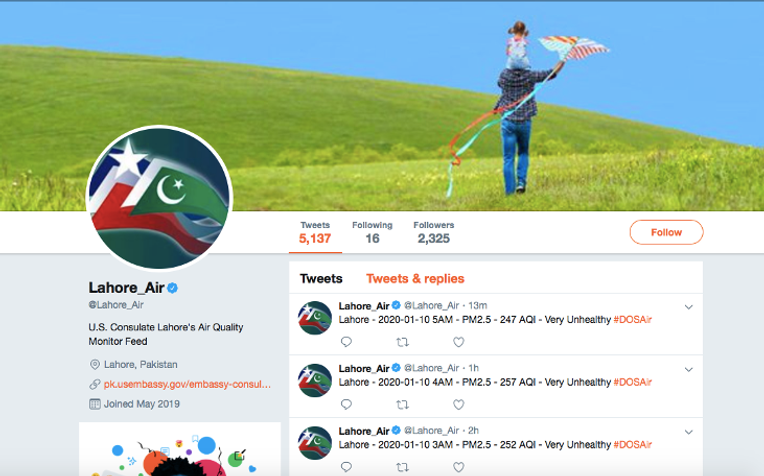
As soon as the smog rolled into Lahore at the end of last October, there was much talk among those new to Lahore’s “fifth season” (myself included) concerning how to read the air, and which sources to refer to for information. Some foreign students looked to the "NowCast Air Quality Index" maintained by U.S. diplomatic missions around the world. The U.S. embassy and consulates in Islamabad, Lahore, Peshawar, and Karachi have set up air quality monitors that measure, convert, and translate the air into knowable standards to “help inform health-related decisions.” The monitors “measure airborne fine particulate matter,” which is collected and “translated into actionable information by the US Environmental Protection Agency’s (EPA) NowCast algorithm.” It converts the dangerous airborne fine particulate matter (which is “commonly referred to as PM 2.5 because the particulates are less than or equal to 2.5 microns in diameter”)—a “standard recognized by the EPA”—into an Air Quality Index (AQI) value. Since spring 2019, U.S. consulates and embassies around Pakistan post hourly AQI readings on their dedicated twitter feeds. As seen below, at @Lahore_Air, @Islamabad_Air, @Karachi_Air, and @Peshawar_Air, AQI’s unfurl from a pixelated image of a parent and child flying a kite against hyperbolic blue skies.
The more common tool that I saw students use, however, is the mobile app and website AirVisual. Founded in 2015 and calling itself “the #1 international air pollution app,” AirVisual collects and shares air quality information of over ten thousand locations around the world. The app provides numerical and visual information about the air. The AirVisual app shows that breathers concerned with air must become acquainted with a new technical language. In addition to the “US AQI” reading—which uses the same air quality indices developed by the US EPA—it also provides users/breathers with images, recommendations, and comparisons. Despite growing up in a Canadian pulp and paper town infamous for its malodorous (and quite possibly toxic) air, I had never paid attention to air quality indices (which at that time were not available at the click of an app) before moving to Lahore during a smog season. That November night when I could not see the airplane lights overhead, the airborne fine particulate matter in Lahore maxed the US AQI indices. Yet, even if I had already downloaded the AirVisual app or referred to @Lahore_Air, the AQI on its own would not have given me meaningful information about the air or its impact on my health. For most people, like myself, this data demands explication.
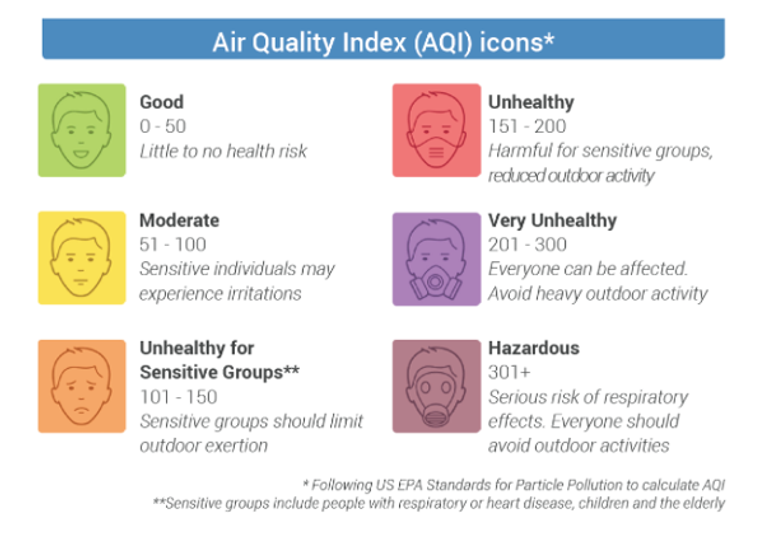
As Choy (2012, 146) notes, “the ongoing tuning, tweaking, and reiterating of numbers, graphs, and maps becomes [sic] central to affective and aesthetic work—the making visible and experienceable (or invisible and unexperienceable) of risks that are difficult to articulate.” The rise of information platforms like AirVisual in the last five years have expanded the repertoire of techniques of visualization and explication. Accompanying the US AQI reading on the AirVisual app and its basic numbers about the atmospheric conditions (temperature, probability of precipitation, wind speed, and so on) are numerous embodiments of translation. There is a description of the US AQI reading, which follows the US EPA categories, which ranges from “Good” (0–50 US AQI) to “Moderate” (51–100 US AQI) to “Unhealthy for sensitive groups” (101–150 US AQI) to “Unhealthy” (151–200 US AQI) to “Very unhealthy” (201–300 US AQI), and, finally, to “Hazardous” (301–500 US AQI). AirVisual also presents icons of faces against the standardized U.S. EPA colored categories of air pollution. There is the smiling face pressed onto a cheerful green background for “Good” while the faces representing the “Unhealthy,” “Very unhealthy,” and “Hazardous” categories wear increasingly heavy-duty protections with the Hazardous icon appearing to wear a HAZMAT-style mask (see image below). AirVisual also provides accompanying health recommendations that translate AQI readings for users/breathers into actionable steps like “wear a mask outdoors,” “run an air purifier,” “close your windows to avoid dirty outdoor air,” and “avoid outdoor exercise.” Furthermore, AirVisual breaks down the day into charts depicting hourly and daily AQI levels and provides forecasts to its users/breathers.
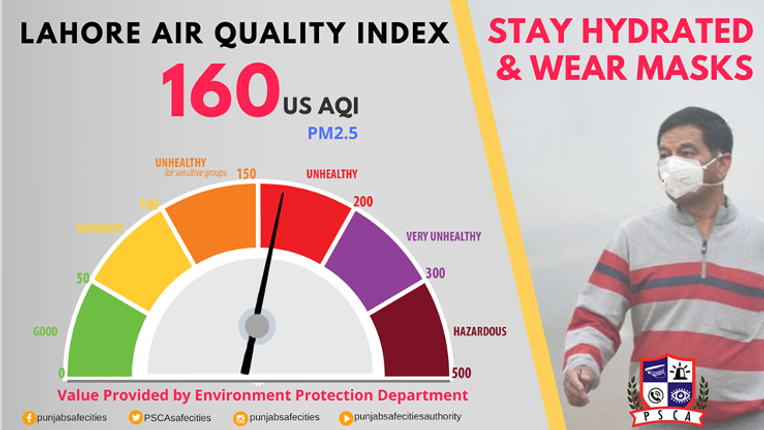
A few government agencies in Pakistan also provide outlets for the sharing of atmospheric information, like the Punjab EPD, which posts US AQI figures on its website. AQIs circulate offline too. For example, the Punjab Safe City Authority (PSCA)—the provincial government authority tasked with reforming urban policing and safety—posts US AQI readings on its electronic information boards along Lahore’s main thoroughfares as well as on its popular social media feeds (see image below). Accompanying the US AQI figures (provided by the EPD) are visualizations situating the viewer-breather within a context of comparison: namely, a speed-o-meter style gauge that locates the daily US AQI figure on the 0–500 scale from “Good” to “Hazardous.” It also includes an image of a man with a mask and EPD recommendations like “stay hydrated and wear masks” in bold red font. Which measurements should be used, however, is contested. For example, the Lahore High Court petition contends that although the PSCA’s practice of publicizing air quality information “generally support[s] the environmental law concept of access to information,” it calls on the PSCA (as well as the EPD) to use other indices (Petition, part A “Facts” at para 8). More generally, as Sabrina Toppa, a Lahore-based journalist told me this past December while I was at LUMS, “government officials, citizens, and entities like AirVisual dispute which monitors to use, where they should be situated, and who has the technical acumen to assess the data.”
Each of these mediums of broadcast situate the viewer/user/breather in relation to different parts of the atmospheric world. The (presumptive) driver seeing the PSCA billboard on a Lahore roadway is directly situated in a specific locale disconnected from any reference point to other places. AirVisual, however, connects its users to other parts of the city if they open the app’s map to see the US AQI readings from different monitoring sites, thus colorfully representing the “geographically uneven distribution of environmental harm” (Choy 2012, 142). Moreover, directly below the AirVisual app’s Lahore summary are the readings of other cities. These sites of comparison, however, are not other cities in Pakistan or even in South Asia, but include (as far as I have seen) Beijing, Seoul, Los Angeles, and Paris (see image below).
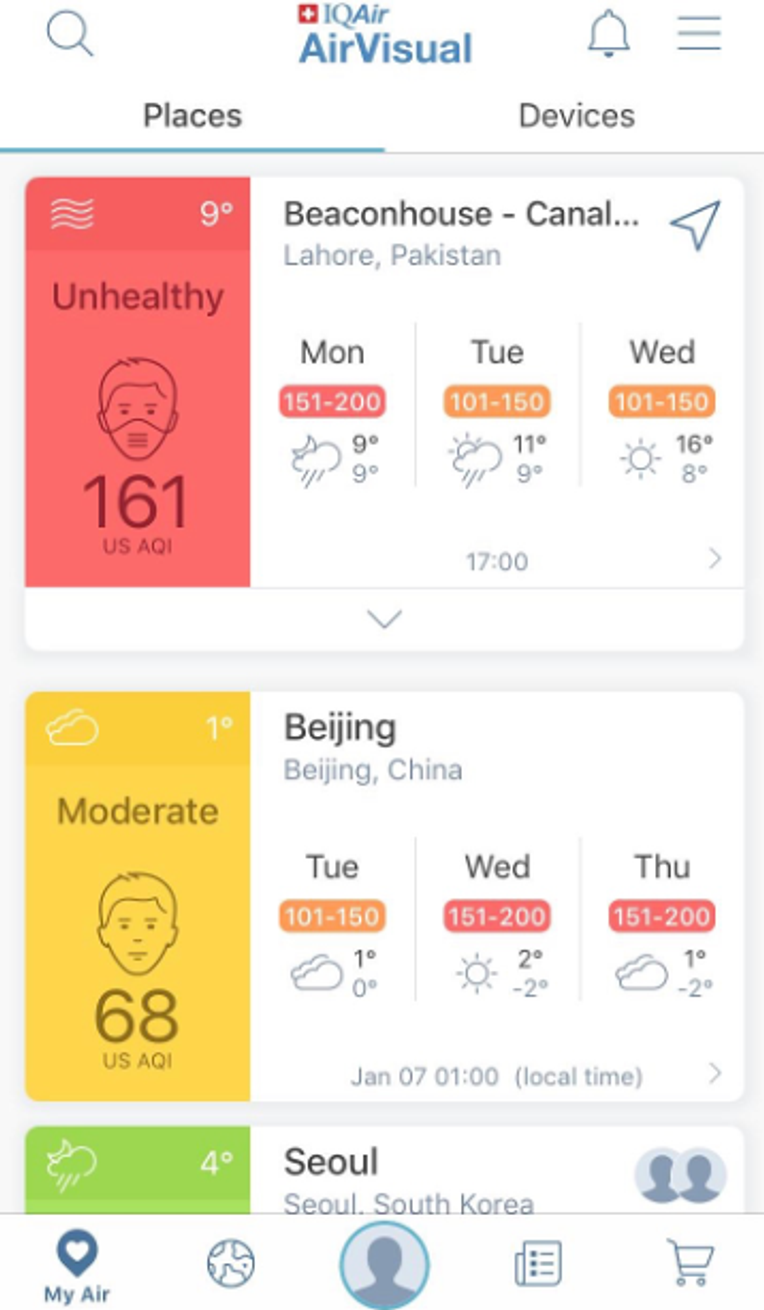
These cities do not have any specific meaning to me as a user/breather in Lahore—I do not live near them, I have not traveled to them anytime recently, nor have I searched for information about their conditions. In what way, and for whom, are these global comparisons meaningful? How does digitally and atmospherically placing the user/breather in relation to these global metropolises matter? What kind of user/breather subject does the app anticipate or create?
AirVisual also presumes another kind of subject in relation to the atmospheric conditions of urban life. Unlike the PSCA electronic billboards or the U.S. embassy and consulate Twitter feeds, AirVisual does not just provide data and recommendations. It also sells monitoring devices (as the Punjab government has pointed out) and along with them, an idea of inclusion within a community of concerned global citizens. As Choy (2012, 131) notes, “the production of . . . air” is a “localizing” as well as “globalizing project” since “it performs membership in an international community of atmospheric and medical science, and in an international global problem.” The AirVisual app goes even further by directly inviting users to “join the movement for a cleaner planet.” You as user/breather can directly make a difference—namely, by purchasing one of their sensors. It is as simple as clicking on a link, thereby revealing the other “contributors” for Lahore, such as the U.S. Department of State, the nongovernmental organization Pakistan Air Quality Initiative, and companies like NetSol Technologies (a publicly traded software technology firm headquartered in Los Angeles County), Beaconhouse (an elite global private school system), SoxLinks (a Lahore-based socks company), and Dawn Bread (one of the largest bread companies in Pakistan).
AirVisual’s website states that:
Low-cost sensor technologies have kickstarted a revolution which can bridge this information gap: by making air quality sensors available at an accessible price point, communities around the world are seizing the opportunity to take their local air quality into their own hands, and reveal this invisible killer.
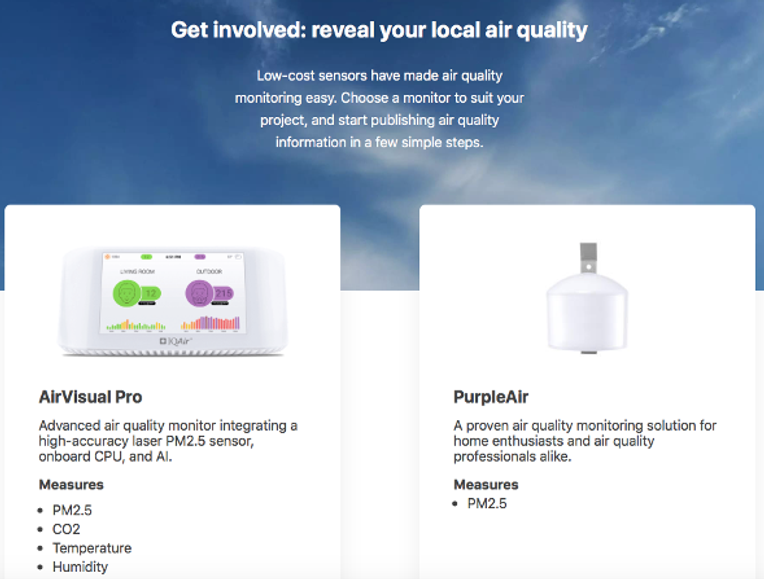
When I click the button “Become a Contributor,” I am directed to purchase the AirVisualPro or other sensors from PurpleAir—“an air quality monitoring network built on a new generation of ‘Internet of Things’ sensors”—costing between US$179 to US$259 (see image below). Now, buyers/breathers too can share their personal AirVisual Pro’s data “with the community.”
The PSCA, U.S. embassy and consulate Twitter feeds, and AirVisual all provide information to users/breathers and suggestions as to how people can take responsibility for themselves by monitoring risk, adjusting their behaviors, and thus improving their own health: wear a mask, stay indoors, run an air purifier, reduce strenuous exercise, and so on. Yet, what does all this information mean to a user/breather? In particular, what does this information mean to the Lahoris that do not have access to a smart phone or the Internet on a daily basis? Or even if they do, what can most people really do with this information? Even if people read the AQI figures, most people cannot substantially reduce their exposure despite AirVisual’s chipper claim that, “[l]iving in a polluted environment can be challenging. However, it is perfectly possible to breathe world-class, healthy air even in a polluted city as long as you take the right precautions to protect yourself.” Anecdotally, numerous people I spoke to simply said they did not bother with the app because they knew the air was terrible anyways. What more did they really need to know?
Yet much of the ongoing debate around Lahore’s air quality concerns gaps in data. The focus of activism, lawsuits, and corporate interventions have thus revolved around making known what generally cannot be known through our basic human senses (even if we can see the haze): specifically, the fine particulate matter that can penetrate lungs and bloodstreams. The establishment of knowledge infrastructures—like monitors as well as the mobile apps, Twitter feeds, and electronic billboards that circulate this knowledge—appear as a kind of truth-telling or reckoning with the city’s atmospheric reality. This data, however, demands novel forms of representation and dissemination that translate these numbers into meaningful knowledge through illustrations, written advisories, charts, and comparisons. I do not seek to undermine the calls for more data. The numbers, themselves, are extremely significant. As the journalist Sabrina Toppa pointed out to me, “there are a cascade of policies that should go into effect as soon as a certain air quality thresholds get crossed, necessitating the closure of schools, hospitals being alerted, and factories shutting down. Without real-time live data, these policies are not triggered.” However, I hope to show that emerging knowledge infrastructures underscore, first, how contemporary environmental and health crises are often managed through monitoring (Murphy 2006), and, second, how the materialities they organize—like the air we breathe—are embedded in particular kinds of capitalist relations.
References
Bowker, Geoffrey C., Karen Baker, Florence Millerand, and David Ribes. 2010. “Toward Information Infrastructure Studies: Ways of Knowing a Networked Environment.” In International Handbook of Internet Research, edited by Jeremy Hunsinger, L. Klastrup, Matthew Allen, and Lisbeth Klastrup, 97–118. Dordrecht, Netherlands: Springer.
Choy, Timothy. 2012. “Air’s Substantiations.” In Lively Capital: Biotechnologies, Ethics, and Governance in Global Markets, edited by Kaushik Sunder Rajan, 121–53. Durham, N.C.: Duke University Press.
Choy, Timothy, and Jerry Zee. 2015. “Condition—Suspension.” Cultural Anthropology 30, no. 2: 210–23.
Fortun, Kim. 2012. “Biopolitics and the Informating of Environmentalism.” In Lively Capital: Biotechnologies, Ethics, and Governance in Global Markets, edited by Kaushik Sunder Rajan, 306–27. Durham, N.C.: Duke University Press.
Murphy, Michelle. 2006. Sick Building Syndrome and the Problem of Uncertainty: Environmental Politics, Technoscience, and Women Workers. Durham, N.C.: Duke University Press.
———. 2008. “Chemical Regimes of Living.” Environmental History 13, no. 4: 695–703.
Whitington, Jerome. 2018. Anthropogenic Rivers: The Production of Uncertainty in Lao Hydropower. Ithaca, N.Y.: Cornell University Press.